
The Hidden Cost of Having No Financial Plan: How Canadians Are Falling Behind
Most working Canadians still expect to fund retirement themselves. Most retirees do not. New surveys and official statistics from 2024 through 2026 show a country that is aging faster than it is planning: fewer people preparing for retirement than five years ago, thin or empty emergency funds, household debt near $1.80 for every dollar of disposable income, and rising consumer insolvencies. The result is not only a smaller nest egg. It is a lower standard of living in retirement, longer working lives, one-bill-away fragility, and money anxiety that follows people to work and to bed. Housing costs and missing workplace pensions are real constraints. The data also show that a written plan changes the odds: people with professional advice are more than twice as likely to say they can retire when they want.

The Hidden Cost of Having No Financial Plan: How Canadians Are Falling Behind
By the numbers from 2024–2026: retirement shortfalls, emergency-fund gaps, record household debt, and the stress that follows.
Ask a working Canadian how retirement will be paid for and a familiar answer appears: personal savings. Ask people who have already retired, and the picture flips. A 2026 CAAT Pension Plan study found that one in four workers expect savings to be their main source of retirement income. Only 15 percent of retirees say that is what actually happened. Nearly six in ten rely first on the Canada Pension Plan and Old Age Security.
That gap between expectation and reality is the story of financial planning in Canada right now. It is not that households are careless. Many are stretched by housing, food, and debt service. It is that a large share of the country is making the biggest financial decisions of a lifetime — when to retire, how much to save, what to do when the car dies — without a written plan, a known target, or a cash buffer.
The cost shows up in four places: a thinner retirement, a household one unexpected bill from crisis, a debt load that ends in insolvency for a rising number of people, and a steady hum of financial anxiety. The numbers below are from Statistics Canada, the Financial Consumer Agency of Canada, the Office of the Superintendent of Bankruptcy, and major 2024–2026 surveys. They do not describe every household. They describe a pattern that is hard to ignore.
Most Canadians are still flying without a plan
A TD survey heading into 2025 found that 61 percent of Canadians had no financial plan for the year. Sixty-three percent were not working with a financial professional. Seventy percent were not using a budget spreadsheet or app. That is not a niche problem. That is the majority.
Retirement preparation has gone backward. The Financial Consumer Agency of Canada’s Canadian Financial Capability Survey reported that only 49 percent of non-retirees were preparing for retirement in 2024 — on their own or through an employer plan — down from 69 percent in 2019. Confidence in expected retirement income fell from 55 percent to 31 percent. Only 32 percent said they had a good idea how much they needed to save, down from 47 percent.
CPP Investments found the same hole in a different survey: 55 percent of non-retirees and 44 percent of retirees said they do not have a retirement plan. Ontario’s pension regulator has reported that eight in ten respondents had not fully developed a plan and two-thirds had never calculated the number they would need.
Not knowing the target is not a paperwork issue. It is how households under-save for twenty years and then discover, at 62, that the lifestyle they pictured does not match the income they will have.
A plan changes those odds. In a KPMG Canada poll, 80 percent of people with a professionally prepared plan said they were financially secure enough to retire at the age they wanted. Among people with no plan, that figure was 36 percent. Even a self-created plan (72 percent) beat having none. Advice is not magic. It is a written path with a number attached.
Retirement arrives smaller than people expected
The standard of living drops
Four in ten retirees told FCAC that their current financial standard of living is lower than they had anticipated before they stopped working. That is the quiet version of “running out of money”: not destitution, but a permanent downshift — fewer trips, tighter groceries, delayed home repairs, adult children helping with bills.
Anxiety about the years ahead is widespread. CAAT found that 49 percent of Canadians worry about outliving their savings and 60 percent fear inflation will eat what they have left. The National Institute on Ageing’s 2025 survey of people 50 and over found that the share who can afford to retire when they want has fallen from 35 percent in 2022 to 29 percent. Forty-three percent say they cannot retire on their preferred date. Twenty-two percent of that 50-plus group had less than $5,000 in retirement savings. Only 7 percent had more than $1 million.
The nest egg does not match the dream
BMO’s 2026 retirement survey put the average amount Canadians believe they need for a comfortable retirement at $1.7 million. Thirty-six percent said they are unlikely to get there. Typical monthly saving is far smaller. Many households put aside less than 5 to 10 percent of income, if they save for retirement at all.
The Healthcare of Ontario Pension Plan’s Canadian Retirement Survey put a sharper edge on the near-retiree years. Thirty-nine percent of Canadians aged 55 to 64 had less than $5,000 in savings. Seventy-three percent had $100,000 or less. Among women 55 to 64, 36 percent had no savings at all, compared with 22 percent of men. Fifty-seven percent of unretired Canadians felt unprepared. Thirteen percent did not think they would ever retire.
Those figures sit beside a widely cited picture of late-career balances: median retirement savings in the 55-to-64 band around $120,000, with about 40 percent of that age group under $5,000. Almost two-thirds of pre-retirees do not expect to stop working at a traditional retirement age. Working longer is now the unwritten plan.
Income in working life predicts who can save. CAAT found that 60 percent of people earning under $50,000 are not saving for retirement at all. Fifty-eight percent of non-retired Canadians say the absence of a workplace pension limits their ability to save. That is not an excuse. It is the structure of the labour market colliding with the absence of a household plan to replace what work no longer provides.
A pension is still the dividing line
CAAT compared retired households with and without pension income. Average earnings were about $85,700 with a pension and $52,600 without. At the median the gap was starker: $75,000 versus $25,000. Defined-benefit income still accounts for close to half of retirement income for those who have it. For everyone else, CPP, OAS and whatever was saved in an RRSP or TFSA have to carry the load.
Workplace pension coverage is only about 38 percent of employees. Public-sector coverage is high. Private-sector coverage is much lower, near 37 percent. Analyses associated with the C.D. Howe Institute have put the uncovered employee population above nine million, before counting the self-employed. Quebec requires employers to offer a retirement vehicle. Most of the rest of the country does not.
The people least likely to be preparing, according to FCAC, are women, newcomers, youth, Indigenous people, lower-income households, and people with disabilities. Housing status cuts the same way. HOOPP found that 57 percent of non-homeowners had under $5,000 saved, versus 19 percent of homeowners. Statistics Canada has shown how wide the wealth split becomes by pre-retirement: households with a primary residence and an employer pension can have median net worth near $1.4 million; households with neither have been measured near $11,900.
Poverty in old age is the end of that path. About 430,000 seniors lived in poverty in 2022. Many rely almost entirely on OAS and the Guaranteed Income Supplement. Poverty rates are higher among older racialized women (9.1 percent on the Market Basket Measure), immigrant women (7.3 percent), and recent immigrant women (17.4 percent) than among Canadian-born non-racialized older women (3.8 percent). Indigenous seniors’ poverty has been estimated around 21.5 percent. Public benefits prevent worse outcomes. They do not recreate a planned retirement.
Before retirement, there is often no cushion
Retirement is the long problem. The short problem is the next broken transmission.

RBC’s 2026 Emergency Readiness Poll found that 32 percent of Canadians have no emergency fund. Among households earning under $100,000, the figure rises to 38 percent. Fifty-two percent say they have not saved enough for emergencies. Forty-two percent feel one major unexpected expense could put them “over the edge.” Thirty-three percent say even a small unexpected expense could. Seventy-six percent blame the cost of living for making a cushion hard to build. Forty-four percent had already faced an emergency expense in the past year. The shocks people fear most are car and transport costs (39 percent), major home repairs (38 percent), and medical bills (31 percent).
TELUS Health’s Mental Health Index found that 28 percent of workers lack emergency savings to cover basic needs. Those without a cushion score far worse on mental-health measures and are nearly three times more likely to say money worry has damaged productivity at work.
Day-to-day cash flow is already tight. FCAC has reported that about 60 percent of Canadians have trouble keeping up with bills at least sometimes, 34 percent spend more than they earn in a month, 47 percent say they have too much debt, and 49 percent have used a credit card, overdraft, or savings to cover daily expenses. Only 55 percent keep a household budget. When there is no plan and no reserve, the credit card becomes the plan.
Debt turns a planning gap into an insolvency file
Canadian households carry one of the heaviest debt loads in the developed world. Statistics Canada put household credit-market debt near $3.25 trillion in the first quarter of 2026. The seasonally adjusted ratio of that debt to disposable income was about 179.6 percent — roughly $1.80 of debt for every dollar of take-home income. The debt-service ratio, the share of disposable income required for principal and interest, was about 14.75 percent. That is more than households spend on food and beverages, which sit near 9.4 percent of disposable income.
Averages hide who is fragile. Homeowners with pensions can look wealthy on paper. Renters with consumer debt and no workplace plan often have almost no buffer. When a rate reset, a job loss, or a medical bill arrives, the file moves from “stressed” to “formal insolvency.”
The Office of the Superintendent of Bankruptcy counted about 145,800 consumer insolvencies in the 12 months ending June 2026, up 5.9 percent from the year before. Consumer bankruptcies rose 8.4 percent. The first quarter of 2026 was the highest quarterly total of consumer filings since 2009. About 78 percent of those files are consumer proposals — structured partial-repayment plans — not bankruptcies. People are trying to keep their assets. They can no longer service what they owe.
Debt stress is already the majority experience. Recent credit-counselling survey work has found that 65 percent of Canadians feel anxious about what they owe, 46 percent say their debt increased in the past year, and 52 percent pay only a little more than the minimum. Minimum payments are not a strategy. They are what a household does when no payoff order was ever written down.
The cost is also sleep, focus, and food
Money stress is not a soft add-on to the balance sheet. A Centraide–Léger report on financial anxiety found that thinking about personal finances makes 60 percent of Canadians anxious. Forty percent have trouble sleeping because of money. Thirty-four percent say financial stress has made it harder to concentrate at work or school. About nine in ten report at least mild financial anxiety. Thirty-eight percent report some form of food insecurity. Twenty-two percent say they have personally lived through a situation of poverty. The top money worries were food (58 percent), housing (50 percent), and savings (49 percent).
HOOPP found unretired Canadians more often feeling anxious (52 percent), fearful (48 percent), and sad (47 percent) about their finances than a year earlier. Sixty-six percent expect to keep working in retirement to support themselves. TELUS Health reported that cost of living is the number-one financial stressor for 63 percent of workers, that one in five say money worry has directly impaired productivity, and that 60 percent of workers do not fully understand the retirement or savings plan they already pay into.
A plan will not freeze grocery prices. It can stop the secondary injury: not knowing whether the next bill is a crisis, whether retirement is possible, or whether the workplace pension even works the way people think it does.
What the planning failure looks like, line by line
The pattern is consistent across surveys. Each missing piece of a plan has a lived cost.
What is missing | What the data show | How people feel it |
|---|---|---|
A written plan and an advisor | 61% had no plan for 2025; 63% had no professional; only 32% know the savings target | Guesswork for decades, then shock at retirement |
An emergency fund | 32% have none; 42% say one shock could put them over the edge | Credit-card debt, skipped repairs, medical and car bills that become insolvency risk |
A realistic nest egg | Many ages 55–64 have under $5,000 to $100,000; women fare worse | Working longer, a lower living standard, heavy reliance on OAS and GIS |
A workplace pension — or a substitute plan | About 9 million employees have no workplace plan; 60% of under-$50k earners save nothing for retirement | Median retired household income near $25,000 without a pension versus $75,000 with one |
A debt-paydown order | About $1.80 of debt per $1 of income; ~146,000 consumer insolvencies a year | Minimum payments, proposals, lost sleep, pressure on food and housing |
Basic product knowledge | RRSP, TFSA, CPP and OAS are poorly understood; many workers do not understand their own workplace plan | Unused matching, late benefit claims, withdrawals in the wrong order |
A fair caveat — and the first four steps
Housing costs, post-2021 inflation, and the collapse of defined-benefit coverage in the private sector are not imaginary. A spreadsheet cannot invent a down payment in Toronto or Vancouver. Lower-income households cannot “budget” their way into a $1.7 million nest egg. Any honest article has to say that.
The same data still leave a planning gap that is not explained by prices alone. People with a professional plan are more than twice as likely to say they can retire when they want. People who have calculated a number save with more confidence. People with three months of expenses in cash do not put a transmission repair on a 19 percent credit card. The constraint is real. The absence of a plan makes the constraint worse.
The highest-leverage first steps are unglamorous and specific:
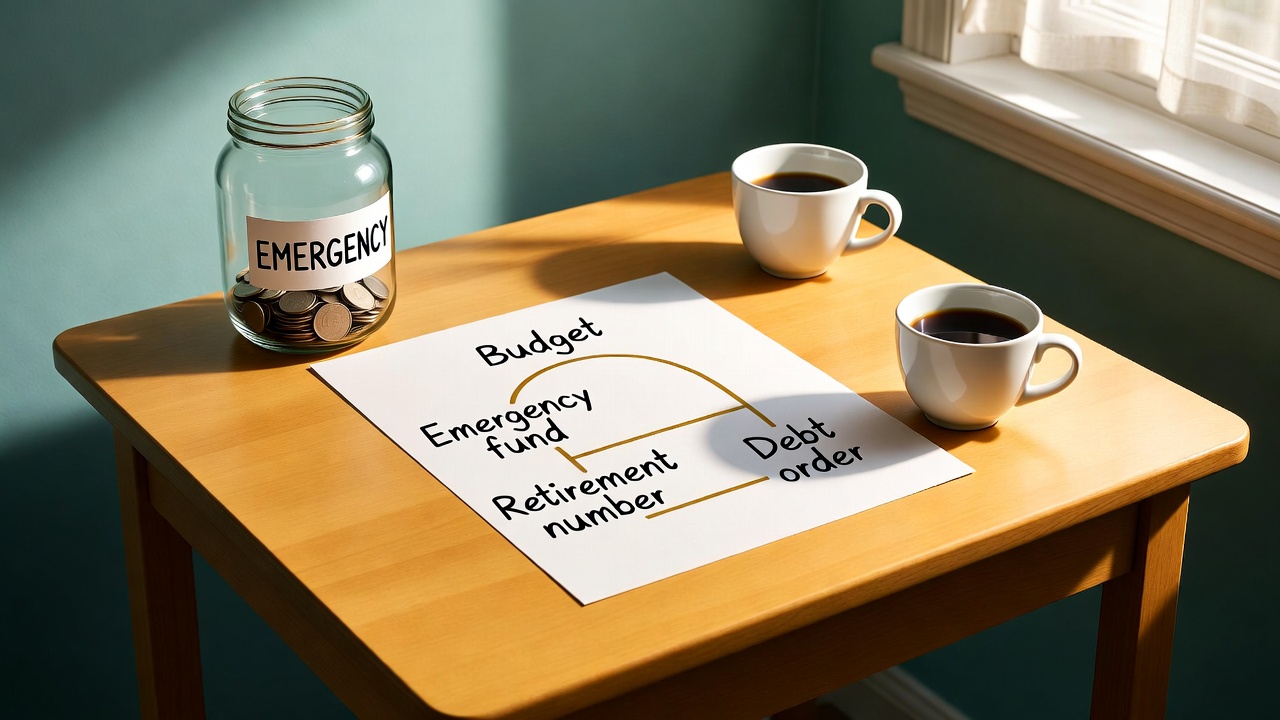
1. Write the cash-flow plan. A household budget is still missing in nearly half of Canadian homes. Know what comes in, what is fixed, and what is left after debt minimums.
2. Build a three-month emergency fund before accelerating investments. The 42 percent who are one shock from the edge are not under-invested. They are under-reserved.
3. Calculate a retirement-income target that includes CPP, OAS, any workplace plan, and personal savings. Service Canada’s Canadian Retirement Income Calculator is a starting point. The goal is a monthly income number, not a vague “million-dollar” headline.
4. Put debts in order. Pay more than the minimum on the highest-rate unsecured balances first. A consumer proposal is a last resort, not a plan.
Households that complete those four steps look like the KPMG “80 percent confident” group. Households that skip them look like the “36 percent with no plan” group. The difference is not optimism. It is a written path.
Sources
Figures are drawn from public Canadian sources published mainly between 2024 and 2026. Survey methods differ. Treat percentages as directional evidence, not a single official series.
Financial Consumer Agency of Canada — Canadian Financial Capability Survey 2024 and Data Story on retirement preparation (updated June 2026).
Statistics Canada — National Balance Sheet Accounts; household credit-market debt and debt-service ratio (Q1 2026); senior low-income and Market Basket Measure analyses.
Office of the Superintendent of Bankruptcy (ISED) — Insolvency Statistics in Canada, June 2026 and 2025 annual report.
CAAT Pension Plan — Nine Realities of Canadian Retirement (June 2026).
Healthcare of Ontario Pension Plan (HOOPP) — Canadian Retirement Survey 2024 and 2025.
National Institute on Ageing — Ageing in Canada Survey 2025.
CPP Investments — Retirement Survey 2025.
BMO Annual Retirement Survey (February 2026); TD financial-plan survey (2025); KPMG Canada financial-plan poll (October 2025).
RBC Emergency Readiness Poll (July 2026).
TELUS Health Mental Health Index (September 2026).
C.D. Howe Institute and related analyses on workplace pension coverage; Maytree on seniors in poverty; Centraide–Léger financial-anxiety report.
This article is an educational compilation of published statistics. It is not financial, legal, or tax advice and is not a prediction for any individual household.
Rajesh Chowdhry
Rajesh Chowdhry is Financial and Business Consultant with 30 years of experience in Estate Planning, Corporate Restructuring, Trust Formation and applying strategies to bring tax efficiencies in the structures.
Recent Posts
If You Already Have a Trust or Freeze, Here Is How to Know Whether It Still Fits
August 29, 2026
Questions to Take to Your Accountant This Year If You Own a Private Company
August 21, 2026
Tax-Efficient Strategies for Business Owners with Significant Retained Earnings
August 15, 2026
How the 21-Year Rule Affects Family Trusts — and What You Can Do About It
August 15, 2026